
Text +1 (213) 928-7320
Let's chat!

Phone Charger Kiosk Revenue: What Distributors Actually Earn
Nine out of ten Americans have experienced low battery anxiety, which is that creeping dread when the percentage drops below 20%, and there's no outlet in sight. A 38% battery life, with Gen Z starting to sweat at 44%. This isn't a minor inconvenience. It's a behavioral shift that's spawned an entire industry built on renting portable power to people who can't afford to go dark. The phone charger kiosk business has ridden this anxiety into a multi-billion-dollar global market. The shared power bank market reached $18.63 billion in 2025 and is projected to climb toward $80.89 billion by 2034. Those are eye-catching numbers. But if you're a prospective distributor, the person actually buying kiosks, negotiating venue placements, and watching the revenue trickle into your account, the headline market size tells you almost nothing about what you'll actually earn.
The Market Opportunity Behind the Hype
Americans check their phones an average of 205 times per day. Battery life ranks as the top feature for 76% of consumers when choosing a new smartphone. Despite manufacturers pouring billions into battery technology, usage patterns continue to outpace capacity gains. The result is a permanent demand gap that portable charger rental kiosks are uniquely positioned to fill.
From a market research standpoint, the numbers are substantial but vary depending on how you draw the boundaries. The cell phone charging kiosk segment specifically was valued at approximately $386 million in 2024 and is projected to reach $686 million by 2032, growing at an 8.6% CAGR according to Future Market Report. The broader power bank rental services market tells a bigger story, with projections of a 13.7% CAGR from 2025 to 2032, reaching $27.45 billion globally.
North America leads the charge, accounting for roughly 38% of global revenue in the device charging kiosk category as of 2024. That regional dominance stems from the density of high-traffic venues, stadiums, airports, malls, hospital networks, and entertainment districts that serve as natural deployment sites for kiosk operators. But market growth alone doesn't make individual distributors profitable. The real question is how much of that expanding pie actually reaches the people running the operations on the ground.
What a Single Kiosk Actually Generates
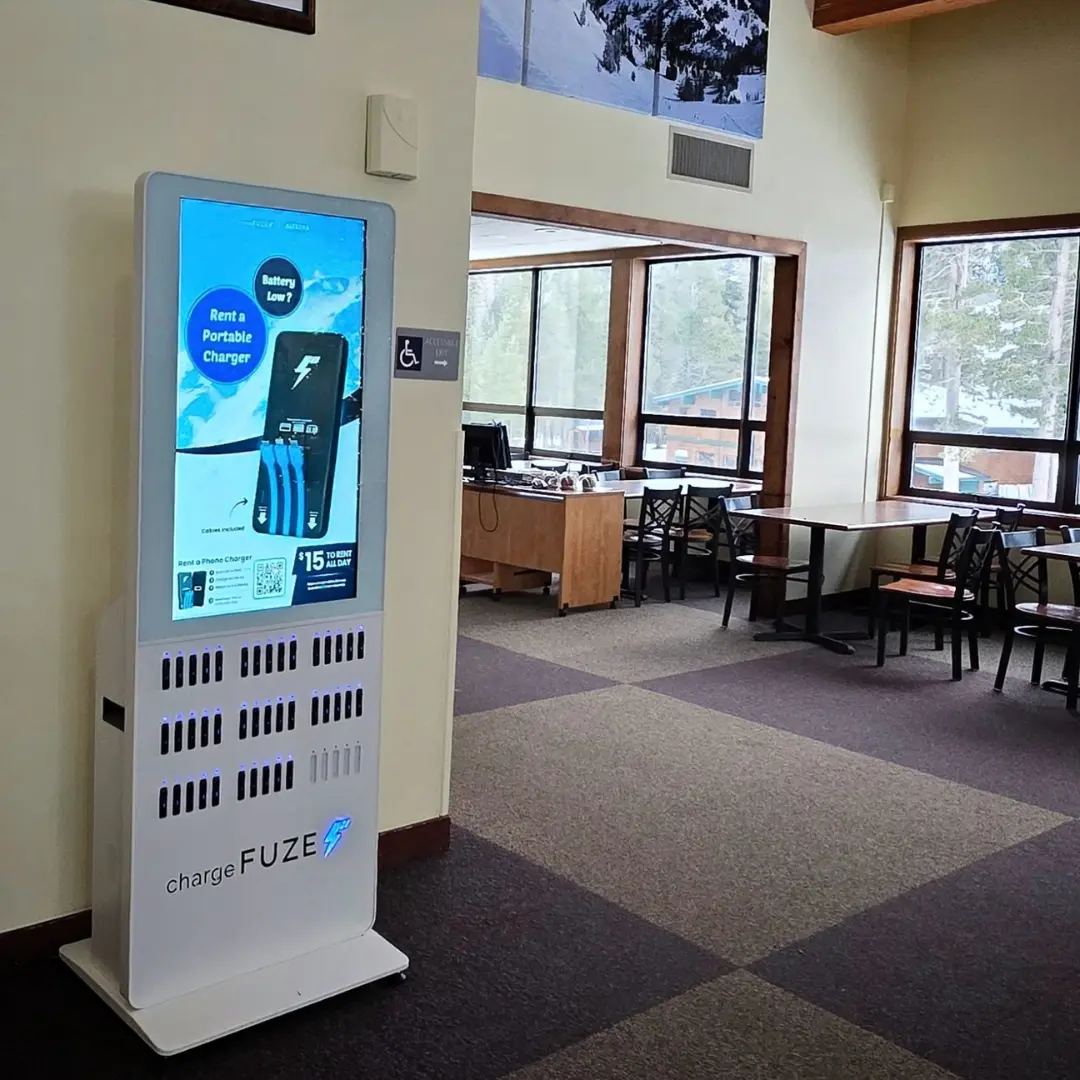
Monthly revenue range of $300 to $1,500 per kiosk, depending heavily on placement quality. A kiosk tucked inside a quiet hotel lobby won't perform like one stationed at a concert venue exit or an airport terminal gate. The variance is enormous, and that's the first honest thing prospective distributors need to internalize.
The revenue per rental typically falls between $1 and $5, with most U.S. operators pricing standard rentals around $1.50 to $3.00 per session. A well-positioned kiosk in a high-traffic venue can see 10 to 20 rentals per day. At $2.00 per rental and 15 daily transactions across 300 operating days, a single kiosk generates approximately $9,000 in gross annual rental revenue.
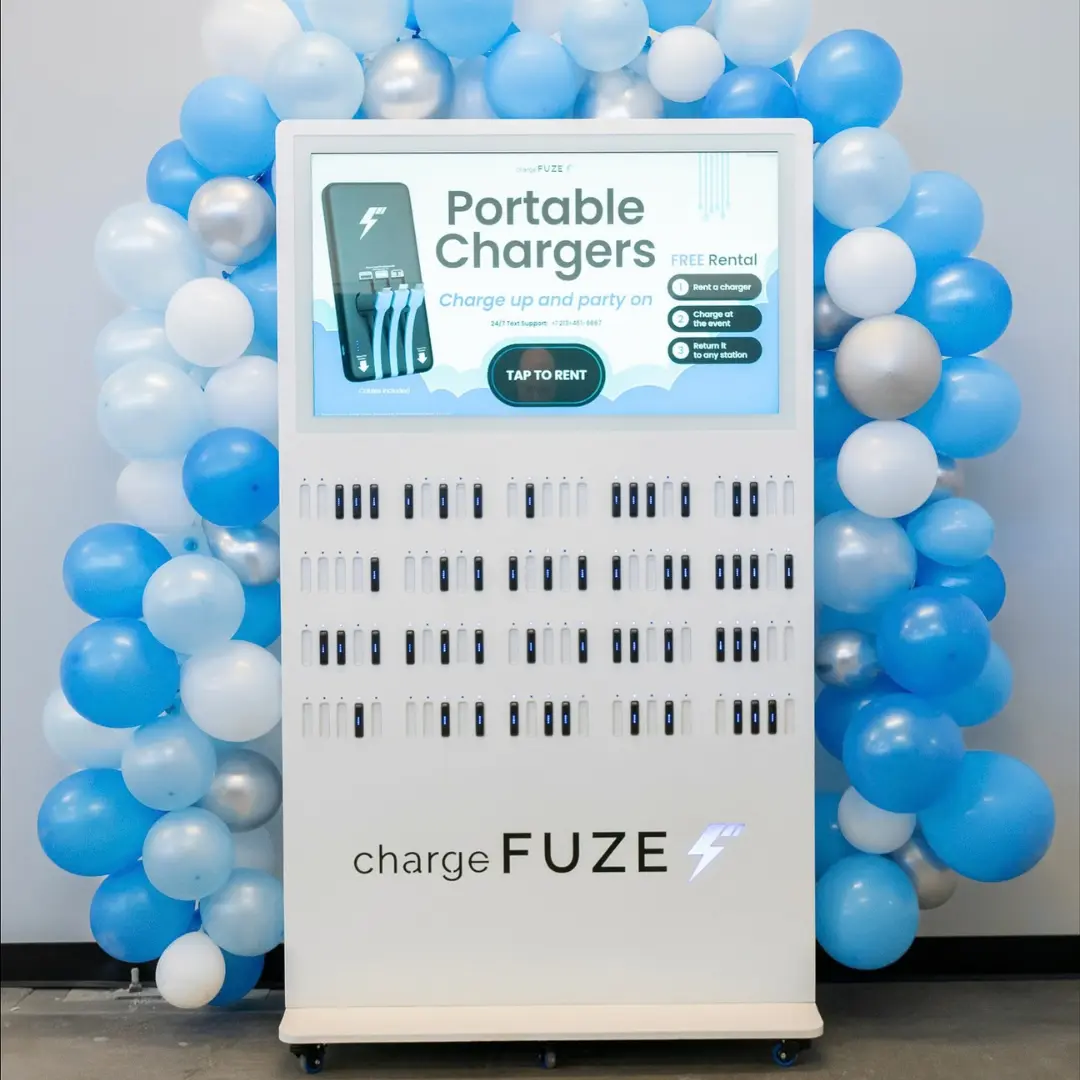
That math looks attractive until you layer in the cost structure. A single charging kiosk runs between $1,500 and $5,000 to purchase, depending on the manufacturer, slot capacity, and feature set. A 12-slot unit with digital signage capability sits at the higher end; a basic 6-slot cabinet is cheaper but generates fewer concurrent rentals.
Most kiosk placements operate on a revenue-sharing model with the host venue. This is the single largest variable most distributor projections understate. Venues typically claim 20% to 40% of rental income. A busy bar or restaurant might accept 20% because the kiosk drives longer dwell time and increased spending. An airport or major stadium will demand 30% to 40% because they know the location practically sells itself. After a 30% venue share on that $9,000 annual gross, you're looking at $6,300 in net rental revenue per kiosk before operating expenses. That's a fundamentally different number than the gross figure, and it's the one your financial plan needs to be built around.
Beyond Rentals: The Advertising Revenue Layer
Rental income is only one piece of the revenue puzzle. The more sophisticated kiosk operations generate meaningful secondary income through digital out-of-home (DOOH) advertising displayed on kiosk screens. Charging kiosks with built-in digital displays create a uniquely captive advertising environment. Unlike a billboard that commuters pass in two seconds, a charging kiosk screen holds a user's attention for 10 to 30 minutes while they wait for their device to power up. That dwell time makes kiosk advertising inventory surprisingly valuable.
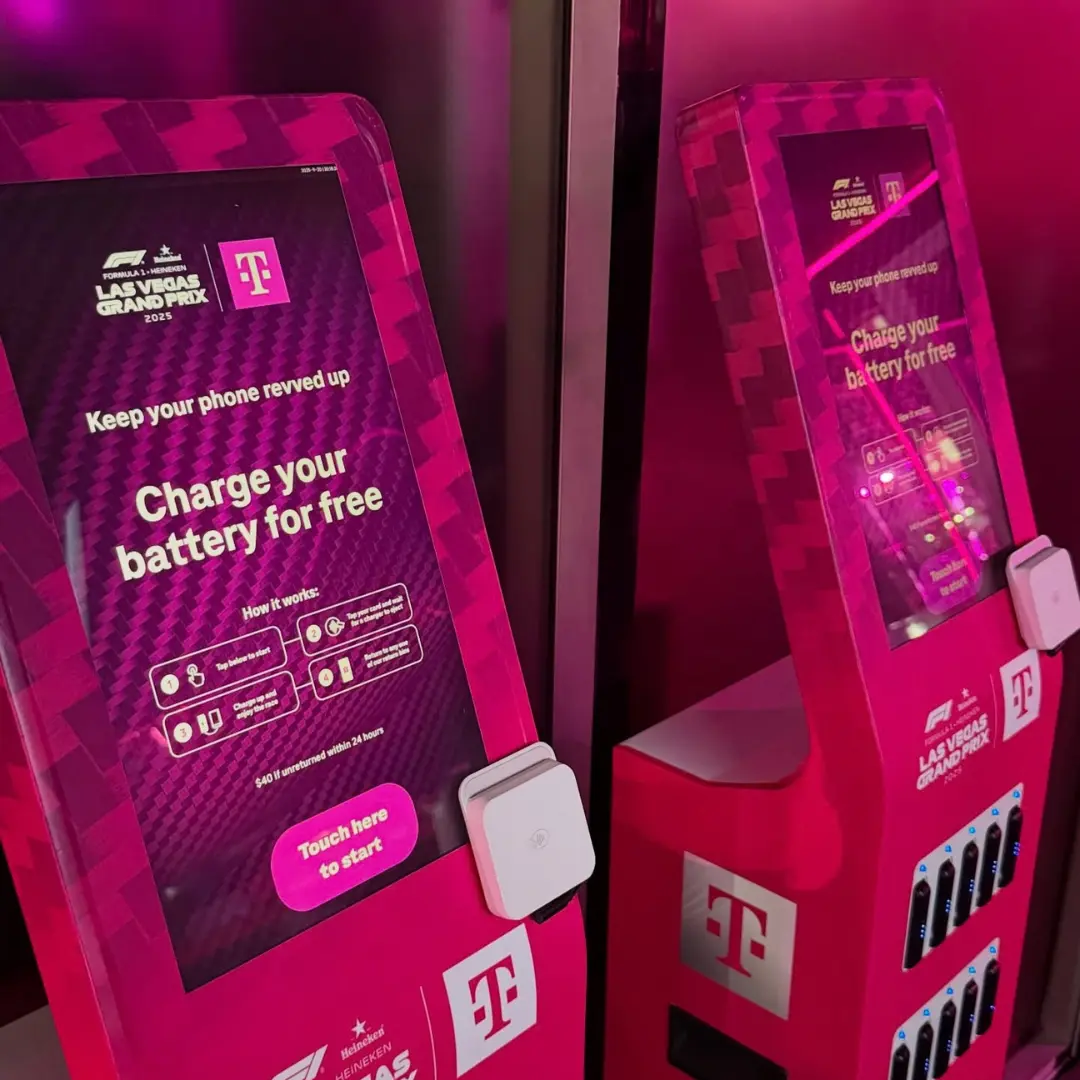
Operators can monetize screens through direct ad sales to local businesses, programmatic DOOH advertising networks, or brand sponsorship packages. The revenue potential depends on screen size, kiosk placement, and the operator's ability to sell or connect to ad inventory platforms. ChargeFUZE has built this dual-revenue approach into its distributor model, offering partners access to both recurring rental income and direct and programmatic DOOH advertising opportunities. Spanning high-profile venues, including Madison Square Garden, Simon Malls, Westfield properties, Live Nation events, and ASM Global-managed facilities, the kind of premium placements where advertising rates command significant premiums. For distributors evaluating which network to align with, the strength of a company's venue partnerships directly impacts the advertising revenue ceiling.
For operators who actively manage their ad inventory, the advertising layer can contribute an additional 15% to 30% of total kiosk revenue, on top of rentals. In premium locations, advertising revenue has been known to cover the cost of the kiosk hardware within the first year, effectively making the rental income pure margin from that point forward.
The Full Cost Picture: What Eats Into Your Margins
Hardware and Deployment Costs
The upfront capital requirement scales with ambition. A small operation of 10 kiosks requires $15,000 to $50,000 in initial hardware investment, based on industry estimates from Startup Financial Projection. Larger city-wide deployments of 50 to 100+ units can demand $100,000 or more. Purchasing refurbished kiosks can reduce hardware costs by 30% to 50%, though warranty coverage and battery quality become trade-offs worth scrutinizing.
Operating Expenses That Add Up
The monthly operating cost per kiosk breaks down into several categories that individually seem small but collectively matter:
- Electricity and connectivity: $70 to $150 per month per kiosk for power and cellular or WiFi data, depending on the venue's infrastructure
- Maintenance and repairs: $1 to $5 per power bank per month for wear-related servicing, with full unit replacements averaging $20 to $30 per power bank when batteries degrade
- Software and platform fees: $100 to $300 per month for fleet management software, payment processing, and customer-facing app infrastructure
- Logistics and redistribution: This is the cost most newcomers underestimate. Power banks need to be physically redistributed between kiosks to match demand patterns. Financial Models Lab projects logistics and maintenance costs at roughly 40% of revenue in 2026, covering movement, recharging, and physical repairs across the network. For smaller operators, logistics costs involving fuel, vehicle maintenance, and possible third-party shipping can add $200 to $1,000 monthly.
Every rental kiosk operator faces a persistent issue: customers who don't return the power bank. Most companies handle this by charging a replacement fee billed to the renter's card on file. While this fee technically covers the hardware cost, unreturned units cause inventory shrinkage that disrupts availability at your kiosks and requires ongoing replenishment purchases. Smart operators bake a 5% to 10% annual loss rate into their financial models.
Realistic Margins and Payback Timelines
The Payback Period
For a single well-placed kiosk generating $500 per month in net revenue against a $3,000 hardware investment, the payback period is six months. That's the optimistic scenario, a prime venue with consistent foot traffic and low maintenance needs. For a 10-kiosk deployment at $35,000 total investment generating an average of $350 per kiosk per month in net revenue, you're looking at a 10-month payback period. That's still attractive compared to most small business investments, but it assumes all 10 placements perform at or near expectations.
The more sobering data point comes from larger-scale operations. Reaching break-even on a significant deployment can take approximately 30 months with roughly $450,000 in upfront capital commitment. That's the reality for operators trying to build a city-wide network rather than a small portfolio of cherry-picked locations.
Location Strategy: The Variable That Determines Everything
Tier 1 Venues: The Gold Standard
Airports, major stadiums, large-scale concert venues, convention centers, and casino resorts represent the highest-performing placements. These venues guarantee captive, high-traffic audiences with long dwell times and limited alternative charging options. Kiosks in these environments regularly hit the $1,000 to $1,500 per month range. These venues know their value. They command higher revenue shares (35% to 40%), often require exclusive multi-year agreements, and may impose branding or hardware specifications that limit your flexibility. Competition for these placements is fierce, with established networks with strong brand partnerships having significant advantages in securing them.
Tier 2 Venues: The Reliable Middle
Shopping malls, hospital waiting areas, university campuses, mid-size restaurant chains, and hotel lobbies form the reliable middle tier. Monthly revenue typically ranges from $400 to $800 per kiosk. Venue revenue shares are more negotiable, and placement agreements are easier to secure. Peak hours in venues like cafes, malls, and airports generate over 60% of daily rentals, according to industry analyses. This concentration means that even Tier 2 venues can outperform expectations if their peak hours align with high smartphone usage.
Tier 3 Venues: The Volume Play
Small restaurants, local bars, coworking spaces, and laundromats represent lower-traffic placements that individually generate modest revenue ($150 to $400 per month) but can be secured in volume with minimal venue share negotiations. The economics here depend on whether you can service many locations efficiently enough to keep logistics costs per unit low.
What Separates Profitable Distributors from the Rest
After analyzing market data, cost structures, and venue dynamics, a clear pattern emerges: what distinguishes distributors who build sustainable businesses from those who stall out.
- Venue relationship depth matters more than unit count. A distributor with 15 kiosks across five strong venue relationships will outperform one with 30 kiosks scattered across 30 unrelated locations. Concentrated deployments reduce logistics costs, strengthen venue partnerships, and create leverage for advertising sales.
- Operational discipline on logistics is non-negotiable. The operators who treat redistribution and maintenance as afterthoughts see their margins erode fastest. The ones who build efficient servicing routes and monitor real-time utilization data through fleet management dashboards maintain their edge. This is where partnering with a network like ChargeFUZE can give distributors a meaningful operational advantage over going it alone.
- Diversifying revenue beyond rentals accelerates payback. Distributors who actively sell or connect their screen inventory to DOOH advertising networks recover hardware costs faster and build a revenue floor that cushions against seasonal rental fluctuations.
The distributors who survive their first two years are the ones who modeled average-case scenarios rather than best-case ones, built in a 5% to 10% unit-loss buffer, and didn't over-leverage their initial hardware purchases.
Where the Industry Goes From Here
The phone charger kiosk market is still in a growth phase, but it's maturing in ways that favor professional operators over casual entrants. Consolidation is underway. Larger networks with established venue partnerships and advertising infrastructure are expanding their footprint, making it harder for independent operators to compete for premium placements. The trend toward integrated platforms is accelerating. Consumer expectations are also rising. Early adopters tolerated clunky apps and inconsistent availability. Today's users expect seamless QR-code-based rentals, reliable power bank quality, and a wide network of return locations. Operators who can't deliver on all three lose repeat usage quickly.
For prospective distributors evaluating the opportunity in 2026 and beyond, the honest assessment is this: the economics work, but not automatically. A well-executed deployment of 10 to 20 kiosks in Tier 1 and Tier 2 venues, backed by a strong network partnership and disciplined operational management, can generate meaningful semi-passive income with payback timelines of 6 to 18 months. A poorly planned deployment with weak venue placements and no advertising strategy can take years to break even. The market is growing. The demand is real. But the distributors who actually earn are the ones who treat this like a real business, not a vending machine side hustle.
Sources:
- Business Research Insights — Shared Power Bank Market Size and Trends (2034)
- Future Market Report — Cell Phone Charging Kiosk Market Size, Growth (2032)
- Growth Market Reports — Device Charging Kiosk Market Research Report (2033)
- Spherical Insights — Power Bank Rental Services Market Forecast (2030)
- Reviews.org — Cell Phone Usage Stats (2025)
- TechKV — Smartphone Statistics 2025: Battery Expectations & Consumer Preferences
- StudyFinds — Average Person Starts to Panic When Phone Battery Drops to 38%
- PRNewswire — Low Battery Anxiety Grips 9 Out of Ten People (LG Survey)
- Startup Financial Projection — Portable Charger Rental Startup Costs
- Financial Models Lab — Portable Charger Rental Owner Income
- Financial Models Lab — Power Bank Rental Running Costs
- Financial Models Lab — 7 Ways to Cut Costs and Boost Power Bank Rental Profit
- Eflyn — How Digital Signage and Kiosks Drive New Revenue Streams
- Skynova — The Most Profitable Vending Machines in 2026
- Nasdaq — ChargeFUZE Named Official On-The-Go Mobile Charging Partner of Madison Square Garden Arena
- VapeTM — Power Bank Chargers: Vended vs. Rented